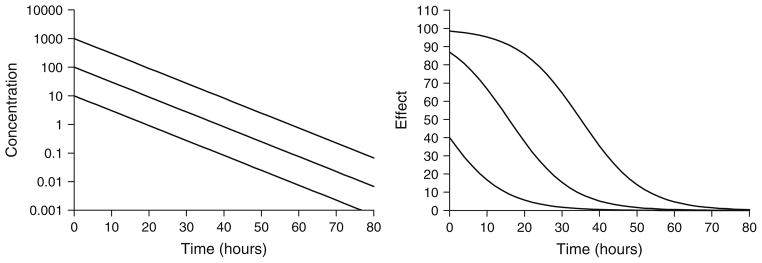
Fig. 2.

Simulated drug concentrations (left) and response curves (right) using a simple Emax model (Eq. 1). Drug concentrations follow monoexponential disposition: Cp = Coe(−kt). Co was set to 10, 100, or 1,000 units to achieve increasing dose levels. Parameter values were k = 0.12/h, Emax = 100 units, and EC50 = 15 units.
