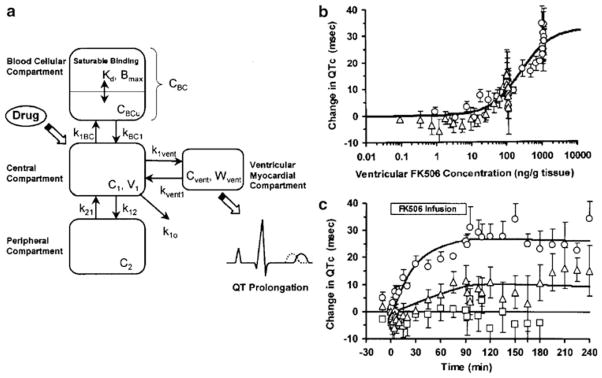
Fig. 3.

Direct effect model of tacrolimus-induced changes of QTc intervals in guinea pigs. The pharmacokinetic model includes both plasma and ventricular myocardial drug concentrations (a), and the latter are associated with changes in QTc according to Eq. 4 (b). The PK/PD relationship results in the time-course of changes in QTc (c). Reprinted from ref. 8 with permission from Springer.
