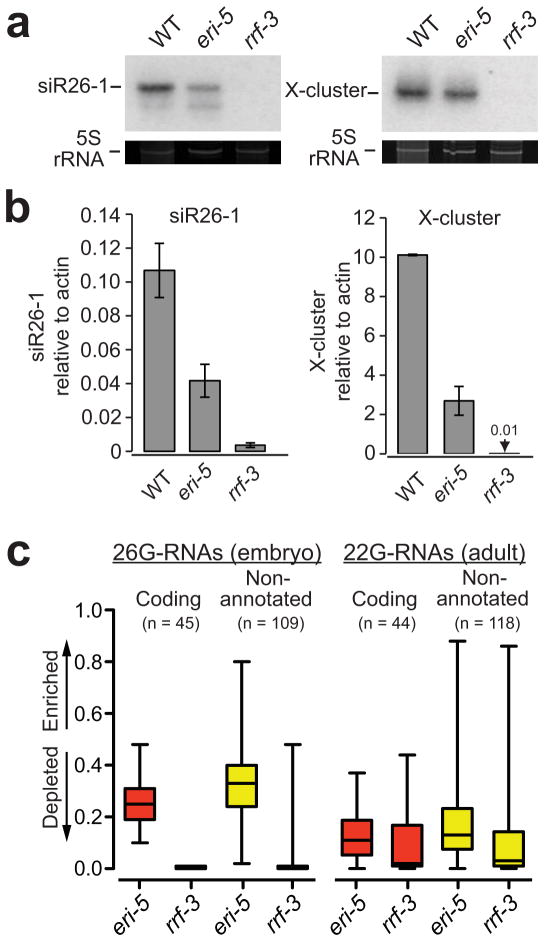
Figure 3. ERI-5 potentiates ERI endo-RNAi small RNA biogenesis.
(a) Northern and (b) qRT-PCR analysis of C40A11.10 26-G-RNAs siRNA species (siR26–1) as indicated in WT, eri-5 and rrf-3 (pk1426) mutant embryos. The C40A11.10 probe detected both 26-G- and 22G-RNAs. 5S ribosomal RNA (rRNA) ethidium bromide staining is shown as a loading control in a. The mean of at least three independent experiments is depicted as the ratio of siR26–1 or X-cluster relative to actin. Error bars indicate s.d. (c) Box and whisker plots show the enrichment or depletion of small RNAs targeting 26-G-RNA coding genes (red) and non-annotated 26-G-RNA clusters (yellow) in the indicated mutant. The left panel is an analysis of 26nt antisense reads from embryo small RNA libraries that target the 26-G-RNA loci. The right panel is an analysis of all antisense reads from adult small RNA libraries that target the 26-G-RNA loci. The majority of reads in the adult samples are 22G-RNAs. Values approaching 1 indicate enrichment of small RNA; values approaching 0 indicate depletion. Relative enrichment was calculated as the ratio of mutant per (mutant + wild-type). The top and bottom of each box represent the 75th and 25th percentiles, respectively. The horizontal line within each box represents the median value. The number of loci used to generate box and whisker plots is indicated above each plot and the data are provided in Supplementary Data 1 and 2.

