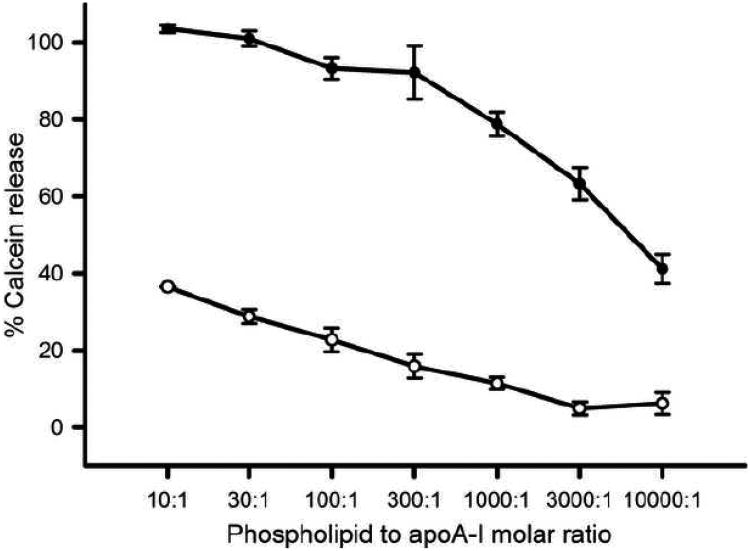
Fig. 7.
ApoA-I-induced calcein release from PG and PC vesicles. A 10 μM suspension of PG vesicles (●) or PC vesicles (○) was incubated with various concentrations of WT apoA-I (1 μM -1 nM, molar lipid to protein ratio of 10:1-10,000:1) after which the % of calcein was determined by the change in fluorescence intensity at 520 nm.

