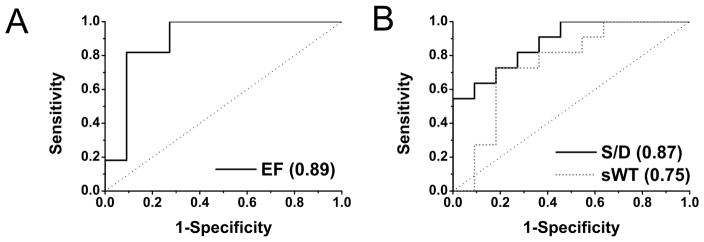
Figure 7.

Receiver operating characteristic (ROC) curves corresponding to the biomarker in relation to the Table: A EF baseline vs. ischemia; B S/D and sWT only during ischemia, remote vs. affected regions. In the legends of each plot, area-under-the-curve (AUC) values are provided. The cut-off point that maximizes sensitivity and specificity for S/D is 1.07. Abbreviations are the same as in Figures 2 and 6 or the Table.
