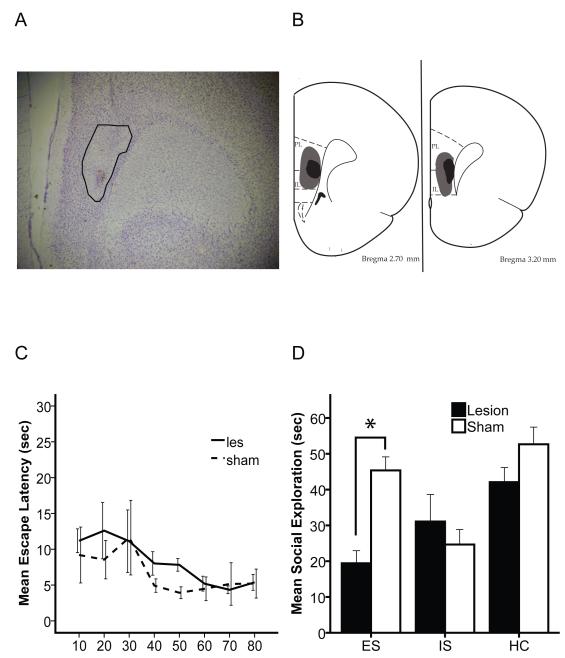
Figure 3.
A, Cresyl Violet stain of lesioned mPFC. Lesion is outlined. B, 2 levels of mPFC (3.2 and 2.7 mm from Bregma) showing the smallest (Black) and largest (Gray) lesion area for each level. C, Average time required by lesion and sham animals (for blocks of 10 trials) to meet wheel turning criteria to terminate shock. D, Mean (+/− SEM) time spent exploring the juvenile conspecific on PND 36 in a 3 min social exploration test. (* denotes significant (p<.05) difference between sham and lesion animals).

