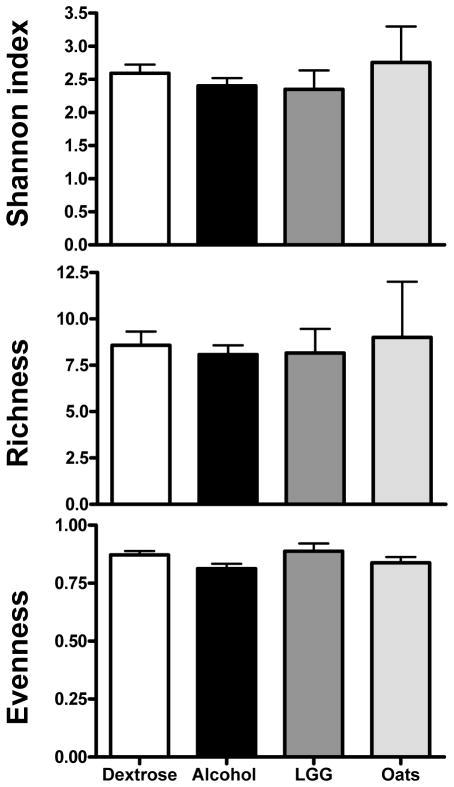
Figure 1.
Mean diversity indices for dextrose, alcohol, LGG and oats groups. Dextrose group is given as white bars; alcohol group as black bars; LGG group as dark grey bars; and oats group as light grey bars. Data is combined for the entire group across all time points, as well as for the ileum and colon samples for the dextrose and alcohol groups. Data shown as mean with SEM. There were no statistically significant differences between the four groups by parametric ANOVA for Shannon and richness; and by Kruskal-Wallis for evenness.

