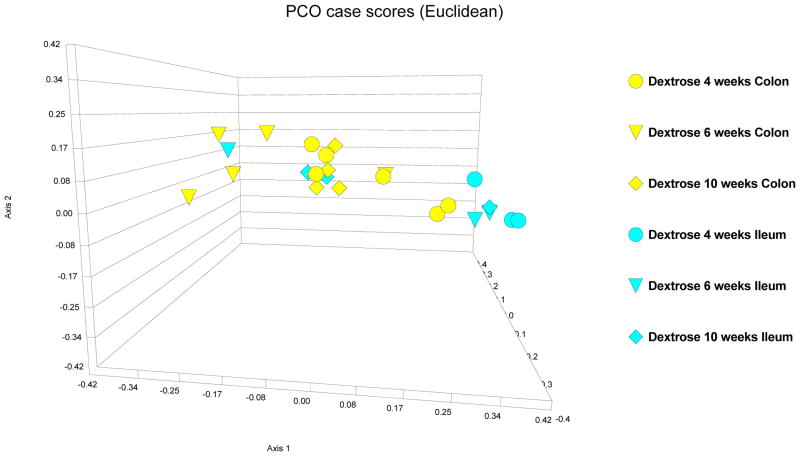
Figure 3.
PCO case scores [Euclidean] of LH-PCR of the colonic and ileal microbiome in dextrose fed rats. 4 week data is depicted as circles; 8 week data is depicted as triangles; 10 week data is depicted as diamonds. Yellow is dextrose fed microbiome in colon and turquoise is dextrose fed microbiome in ileum. The data demonstrate a distinct microbiome composition in the ileum and colon of dextrose fed rats. There are subtle changes in the microbiome pattern in both ileum and colon over the 10 week course of the experiment. But, the main ileal and colonic clusters appear to remain distinct in most samples.

