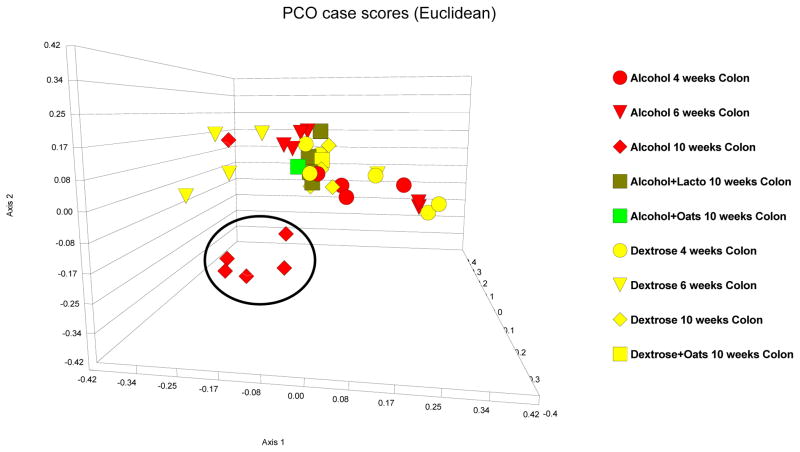
Figure 8.
PCO case scores [Euclidean] of LH-PCR of the colonic microbiome in Dextrose fed [turquoise], alcohol fed [purple] rats. 4 week data is depicted as circles; 8 week data is depicted as triangles; 10 week data is depicted as diamonds. Dark green squares are probiotic (Lactobacillus GG) treated rat colon samples and light green squares are prebiotic (oats) treated rat colon samples. 10 weeks of daily alcohol feeding caused a distinct change in the microbiome pattern compared to the 10 week dextrose feeding [alcohol-induced dysbiosis]. Both daily oats and lactobacillus GG gavage prevented alcohol-induced dysbiosis at week 10.

