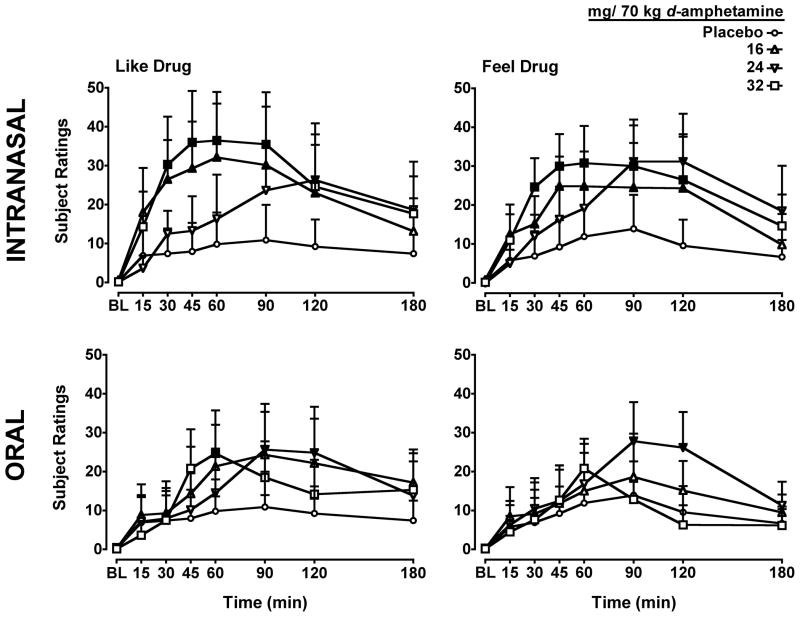
Figure 1.
Dose- and time-response function for d-amphetamine administered by the intranasal (Top Panels) and oral (Bottom Panels) routes of administration for the items Like Drug (Left Panels) and Feel Drug (Right Panels) on a Visual Analog Scale. X-axis: Time after dose administration in minutes and baseline (BL). Filled symbols indicate values that are significantly different from placebo at each time point. Data points show means of 6 subjects. Uni-directional brackets indicate 1 SEM.

