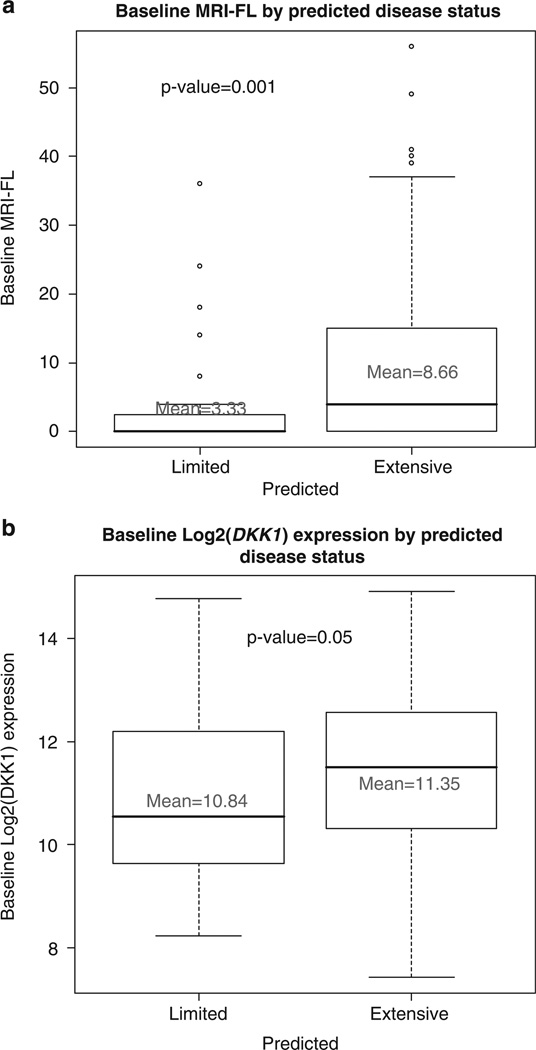
Figure 2.
Baseline focal bone lesions and baseline log2 DKK-1 by predicted disease using the recursive-partitioning model. (a) The number of focal bone lesions (per patient) is plotted for patients with limited bone disease and extensive bone disease predicted by the four single nucleotide polymorphism (SNP) model illustrated in Figure 1. The mean values are identified. The P-value for the difference is P = 0.001. (b) The directly measured log2 DKK-1 expression values are plotted for patients with limited bone disease and extensive bone disease predicted by the four SNP model illustrated in Figure 1. The P-value for the difference is P = 0.05.

