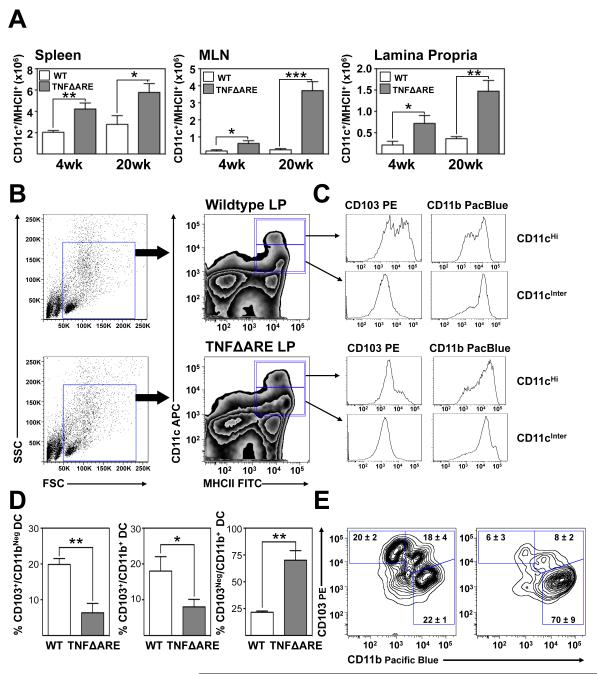
Figure 1. Increased mononuclear phagocytes in TNFΔARE mice.
(A) Total cell counts from indicated organs of TNFΔARE mice aged 4- and 20-weeks-of-age compared with WT littermate controls (Mean ± SEM from 3 individual experiments, n=3 mice/experiment with cells pooled per genotype and time-point. *p<0.05, **p<0.01, ***p<0.001). (B) Representative scatter plots illustrating the gating strategy utilized, which included F4/80+ cells. (C) Representative zebra plots and histograms illustrating the expression of CD103 and CD11b within CD11cHi/MHCII+ and CD11cIntermediate/MHCII+ MP in the LP of 20-week-old WT and TNFΔARE mice. (D) The percentage of indicated MP subsets were assessed by flow cytometry from the LP of TNFΔARE and WT mice at 20-weeks-of-age (Mean ± SEM, n=4, *p<0.05, **p<0.01). (E) Representative zebra and contour plots from LP MP of WT and TNFΔARE mice.

