
Figure 2.
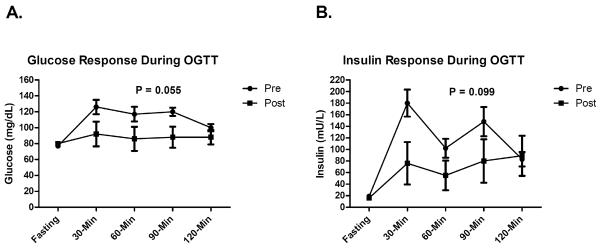
Glucose (panel A) and insulin (panel B) response during the 2-hour OGTT in participants with data pre- and post-exenatide treatment. P-value is for the estimated treatment effect between study arms for AUC over the 2-hour OGTT period. Error bars represent SEM.