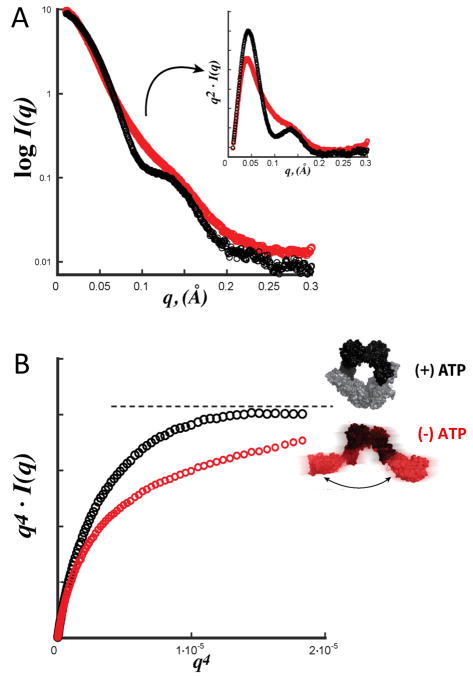
Fig. 6.
SAXS analysis of the Mre11-Rad50 DNA repair complex, in the presence and absence of ATP. A) The SAXS profile combined with the Kratky plots, upper right panel, indicated a change between two conformational states in the presence of ATP (black line) or the absence of ATP (red line). B) The Porod plots more clearly define that the complex is in a compact shape in the presence of ATP (black line), and becomes more flexible in its absence (red line). Figure adapted from experimental data [23, 24].

