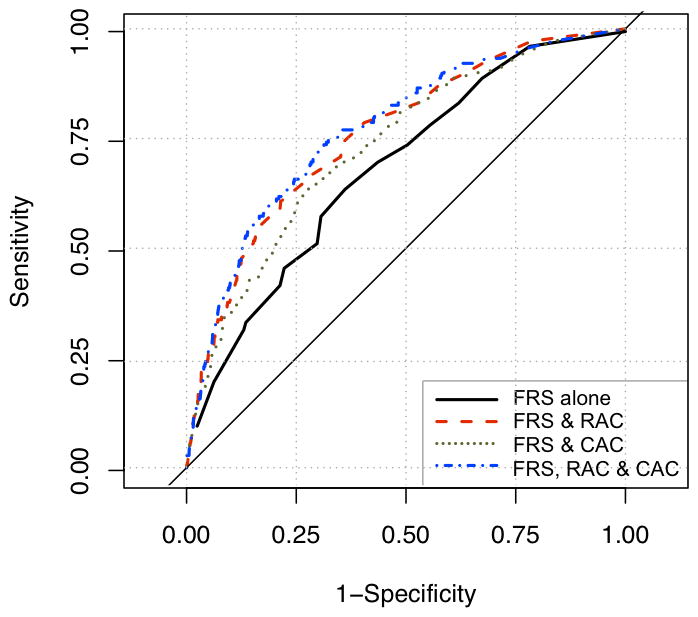
Figure 3. Receiver-operator curves for prediction of all-cause mortality using Framingham score, CAC, and RAC.

Area under the ROC curve for Framingham score (FRS) alone: 0.69; for FRS plus CAC: 0.73; for FRS, CAC, and RAC together: 0.77. p for comparisons between ROC statistics all < 0.01.
