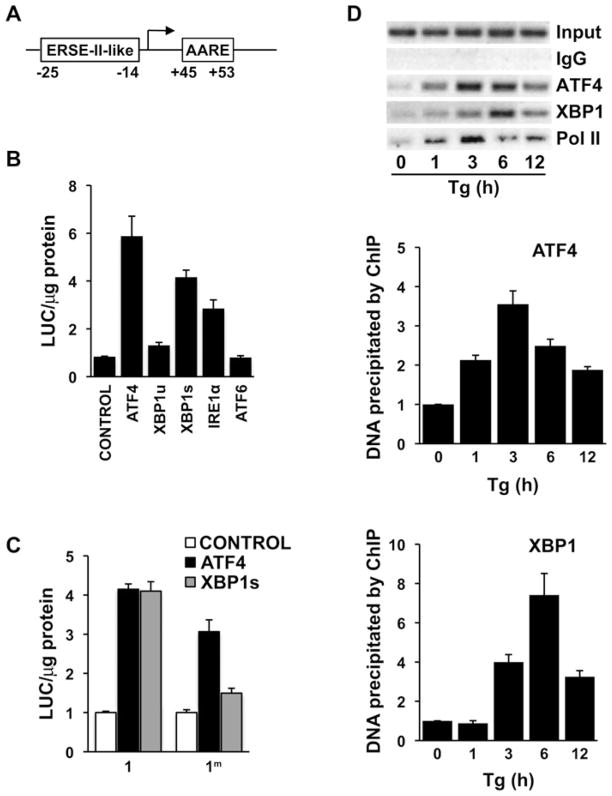
Figure 3. XBP1s and ATF4 regulate Cat-1 gene transcription during ER stress.
(A) Representation of the ERSE-II-like and the AARE sequences within the Cat-1 gene. Numbers indicate the position of the element relative to the transcription start site. (B) C6 glioma cells were transiently transfected with 100 ng of construct 1 or (C) construct 1 or 1m and 100 ng of the indicated expression vectors in six-well plates. Control indicates the cloning vector which was used as a negative control. LUC assays were performed 48 h post-transfection as described in the Experimental section. Results were normalized to protein content and are means ± S.E.M. for three independent experiments. (D) ChIP was performed using C6 cells and the indicated antibodies. Thapsigargin (Tg)-treatment was performed in the growth medium for C6 cells as described in the Experimental section. Samples with normal rabbit IgG were used as negative controls. PCR was performed using the primer pair indicated in the Experimental section; a representative gel from three independent experiments is shown in the top panel. DNA isolated from ChIP analyses using anti-ATF4 (middle panel) and anti-XBP1 (bottom panel) antibodies from three independent experiments were also analysed by qRT-PCR. Values were obtained relative to input DNA and expressed as a fold change relative to untreated cells.

