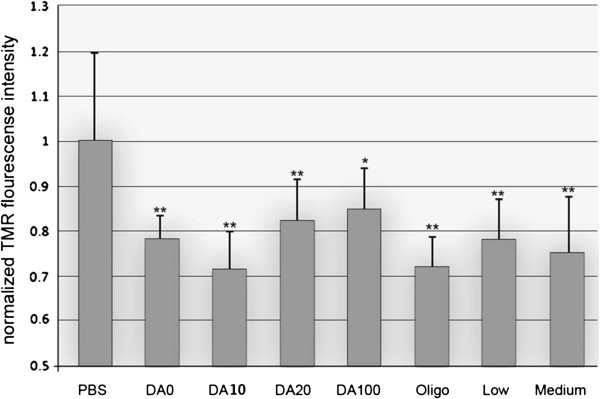
Figure 2.

Quantification of normalized fluorescence intensity of TMR uptake as a function of chitosan treatments. The fluorescence intensity in the PBS group was used as the control. Note that all chitosan treatments significantly decreased the fluorescence intensity of TMR uptake following the transection injury, *P < 0.05, ** P < 0.01 (Dunnett test). A Statistical difference was not observed between chitosan treatments with different DA and MW, P > 0.05 (Tukey test). N = 6.
