Figure 3.

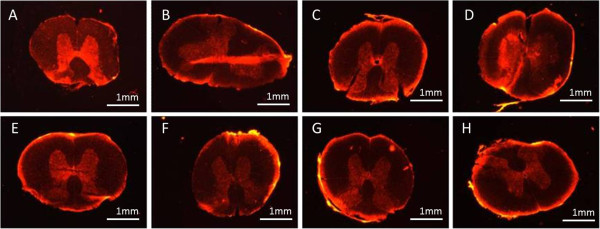
The fluorescence intensity of TMR uptake after transection injury and its inhibition by different chitosan treatments. A) control, B) DA100, C) DA20, D) DA10, E) DA0, F) Oligo, G) Low, H) Medium. See test for nomenclature.

The fluorescence intensity of TMR uptake after transection injury and its inhibition by different chitosan treatments. A) control, B) DA100, C) DA20, D) DA10, E) DA0, F) Oligo, G) Low, H) Medium. See test for nomenclature.