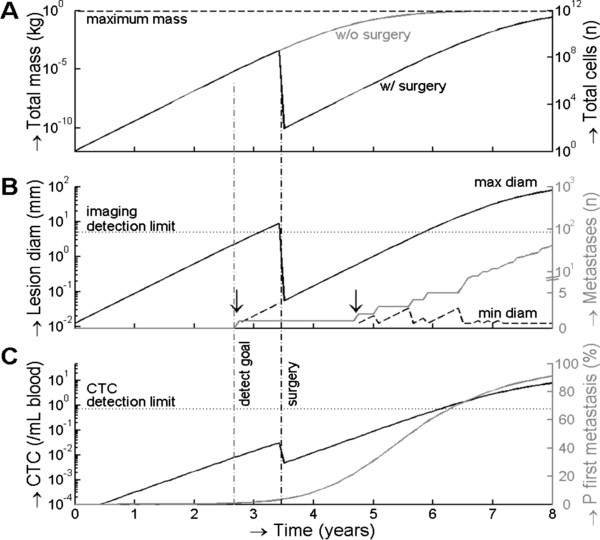
Figure 4.
Application of the model to estimate the technology requirements for radiographic imaging and CTC detection to reduce the probability of distant metastasis to below 1%. Panel A shows the time needed to develop a tumor mass and the number of tumor cells for a stage T1B tumor removed by surgery (black line) or not removed by surgery (gray line). Panel B shows the maximum (black solid line) and minimum size (black dashed line) of the primary tumor and/or metastasis and the number of metastasis in gray. Minimum size is only shown when 2 or more lesions exist, the formation of the second lesion before and after surgery are indicated with a vertical black arrow. Panel C shows the development of the CTC concentration in black, and the cumulative probability that a first metastasis has occurred in gray. The black vertical dashed line indicates the time at which the primary tumor is surgically removed in our model. The cumulative probability is used to determine the detection goal (vertical dashed gray line); the time when the primary tumor needs to be removed to reduce 5 year recurrence from 9% (from all TXNXM0) to 1%. This line intercepts with a CTC concentration of 9 CTC/L of whole blood and a lesion size of 2.7 mm, and represent the required sensitivities for radiographic imaging and CTC detection.

