
Figure 1.
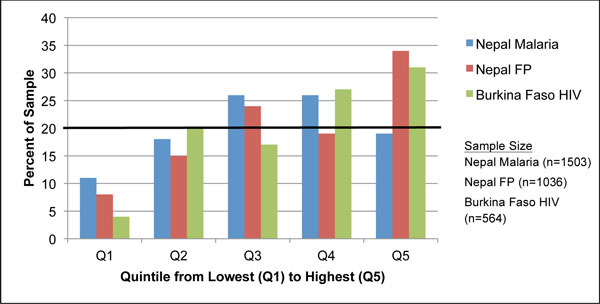
Distributions of survey respondents by wealth quintile and survey. The black horizontal line at 20% denotes the cut-off level for each quintile if wealth were distributed with perfect equity in the study population. Quintile distribution of the reference populations, the corresponding DHS dataset for each PSI survey, is evenly distributed; all quintiles represent 20% of the sample.