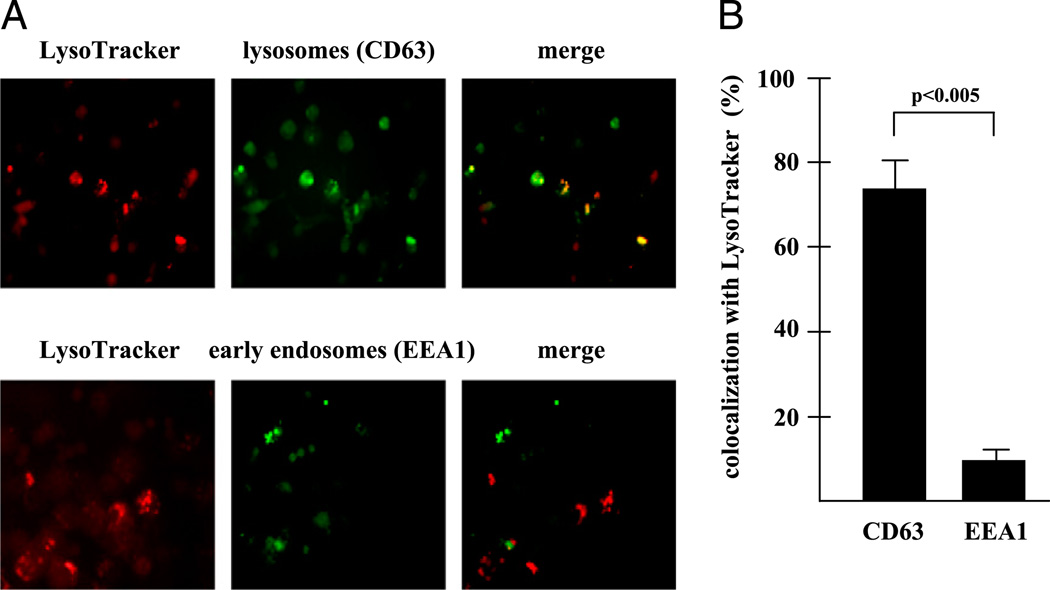
FIGURE 2.
Inhibition of Abl tyrosine kinase induces acidification in lysosomes. (A) MDM were treated with imatinib (5 µM) for 24 h and labeled with CD63 (green, upper panel) or EEA1 (green, lower panel) and LysoTracker (red). The photographs show representative areas of three independent experiments. (B) MDM were treated and stained as in (A). At least 100 LysoTracker-positive MDM were analyzed at a original magnification of ×400 by fluorescence microscopy. The graph shows the percentage of MDM coexpressing CD63/ EEA1 and LysoTracker. Error bars present the SD calculated from the results of three independent experiments.

