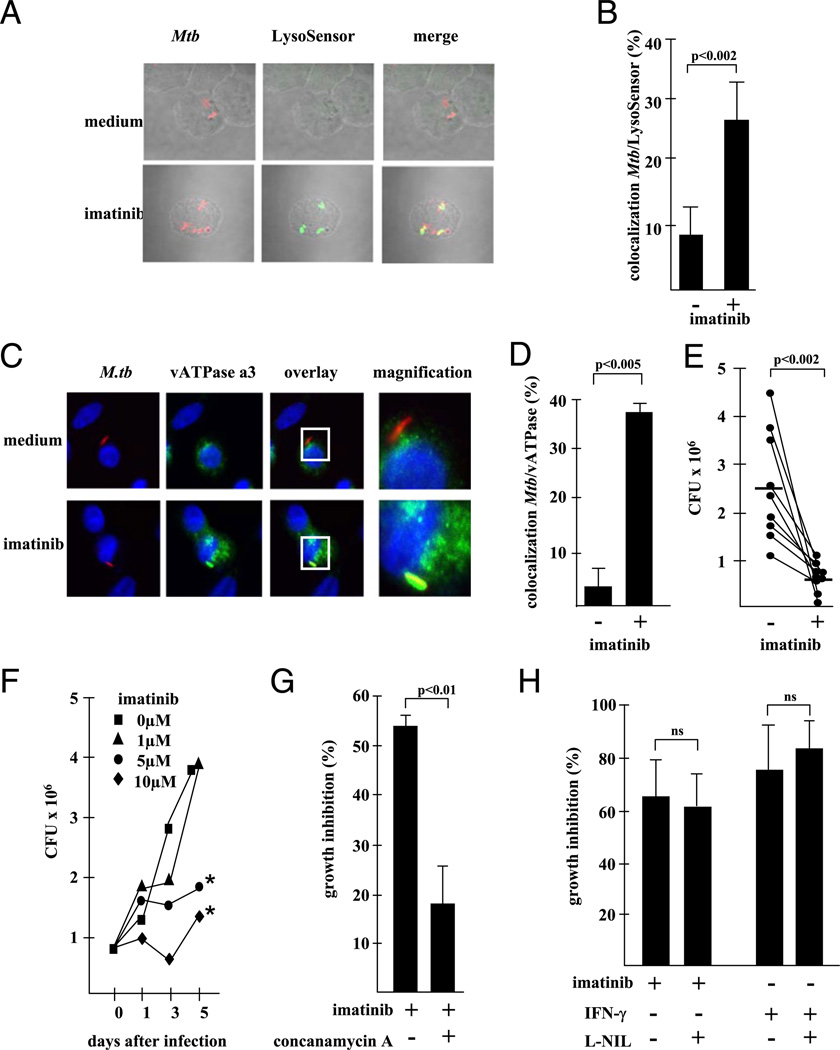
FIGURE 5.
Inhibition of Abl tyrosine kinase induces acidification of the mycobacterial compartment and antimicrobial activity. (A) MDM were infected with Alexa 647-labeled mycobacteria (red, MOI 5) and treated with imatinib (5 µM) for 24 h. Infected MDM were stained with LysoSensor (4 µM) and analyzed by confocal laser microscopy. The photographs present representative areas (original magnification 3630) from one experiment of five performed with different donors. (B) The figure gives the average percentage of LysoSensor-positive mycobacteria of five independent experiments. Error bars show the SD of the results from the five different donors. (C) MDM were infected with Alexa 647-labeled M. tuberculosis (red) overnight and treated with imatinib for an additional 24 h. Infected cells were fixed, permeabilized, and stained with anti-vATPase subunit c (1:500), anti-rabbit Alexa 488 (1:800) Abs, and Hoechst 33258 (1 µg/ml). Slides were analyzed by confocal laser microscopy or conventional fluorescence microscopy and evaluated for colocalization of vATPase and M. tuberculosis. The panels show representative areas (original magnification ×600, inset ×1000) from experiments performed with nine donors. (D) gives the average percentage ± SEM of M. tuberculosis/vATPase double-labeled MDM calculated from at least 200 cells from all nine donors. (E) Infected MDM (24 h, MOI 5) were cultured with imatinib (5 µM), and the number of viable bacilli was determined by plating the cell lysates after 72 h. The graph gives the individual results of all nine donors investigated. The horizontal line shows the mean values. (F) AM were infected with M. tuberculosis (MOI 5, 24 h) and treated with imatinib at the concentrations indicated. The number of viable bacilli was determined by plating the cell lysates directly after removal of extracellular bacilli and before addition of imatinib (time point 0) and 1, 3, and 5 d after initiation of imatinib treatment. The figure shows a representative result of three with comparable results. *p < 0.05, as compared with the untreated controls. (G) Infected MDM were treated with concanamycin A (50 nM) and incubated with imatinib (5 µM, 72 h), and lysates were plated in 10-fold dilutions on 7H9 agar plates. The graph shows the growth inhibition (percentage) as calculated by comparison with the untreated control (n = 5). Error bars show the SD of the results from the different donors. (H) MDM were treated with imatinib (5 µM) or IFN-γ (10 ng/ml) for 3 d in the presence or absence of L-N6-(1-iminoethyl)lysine (1 mM). The number of viable bacilli was determined by plating cell lysates in serial dilutions on 7H9 agar plates. The figure shows the average reduction of CFU (three different donors tested in independent experiments) as compared with untreated control cultures.

