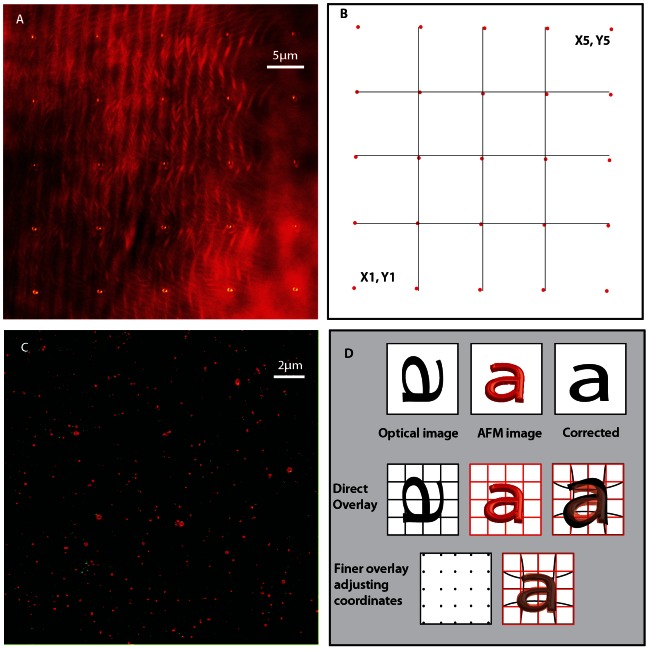
Figure 1. Fluorescence image overlay.
The panel A shows the reflection images made on a 42×42 µm sq area of optical field of view by moving the tip in 35×35 µm sq in order to calibrate this area using 25 points as shown. This is a maximum intensity projection of 25 images to show their respective positions. The panel B shows how the grid is formed in the AFM software by a calibration. Panel C is an overlay of AFM on STED image using these calibration points given by AFM software. The green channel corresponds to AFM peaks while the red channel shows the STED image of the respective bead position. The overlay image is threshold corrected to enhance contrast. Although AFM software does a good job in overlaying confocal images, STED image overlay shows an imperfection, which gets stronger towards the borders. Panel D shows the total overlay procedure we follow where we edit the grid points to nonlinearly stretch and place the fluorescent image. In the first row of this panel, we show a cartoon of the collected optical image with inherent aberrations, AFM and the corrected image. Second row depicts the direct overlay software, which calibrates the pictures and makes a grid automatically. Nevertheless, a finer overlay is obtained by adjusting these grid points manually, especially when you overlay optical images from higher resolution imaging schemes where the pixel size of the image are well below the diffraction limit. Although the AFM software allows you to edit these values in its calibration ASCII file, we used a Labview routine for editing and artificially creating these set of 25 points.

