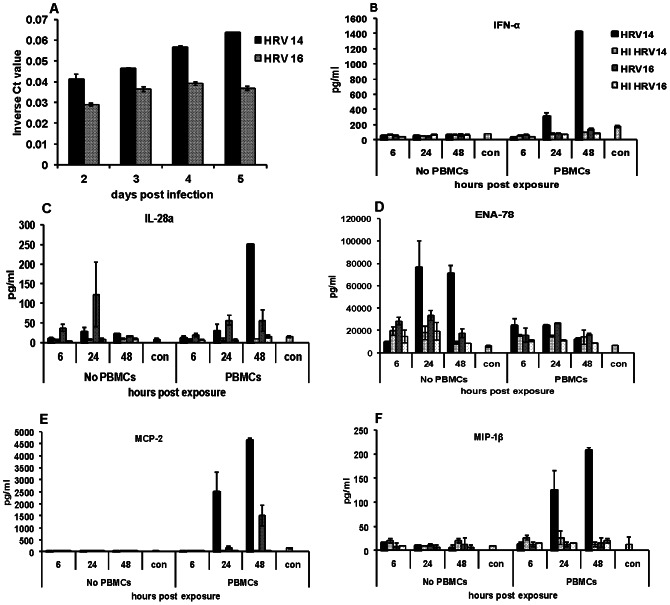
Figure 1. Time course of replication and cytokine production in HRV 14 and HRV 16 infected Calu-3 cells.
Fig 1A . The relative amount of viral RNA detected in supernatants of Calu-3 cells infected with 0.5 MOI of HRV 14 or HRV 16 in real time (RT) PCR and represented as inverse cycle threshold (Ct) values. Ct levels reflect the number of cycles required to exceed the background level; inverse Ct levels (1/Ct) are proportional to the amount of target nucleic acid in the sample. RT-PCR underwent 40 cycles of amplification. The data are represented as average ± SD from a representative experiment. Fig 1B, 1C, 1D, 1E and 1F . Levels of cytokines (pg/ml) in the supernatant of Calu-3 cells infected with HRV 14 or HRV 16, heat inactivated (HI) viruses and uninfected control (con) cells with or without PBMCs. The 6, 24 and 48 hour time points represent hours after the time inserts with PBMCs were added to the Calu-3 cells. Data are average ± SD from duplicate wells for one experiment that is representative of the four experiments.

