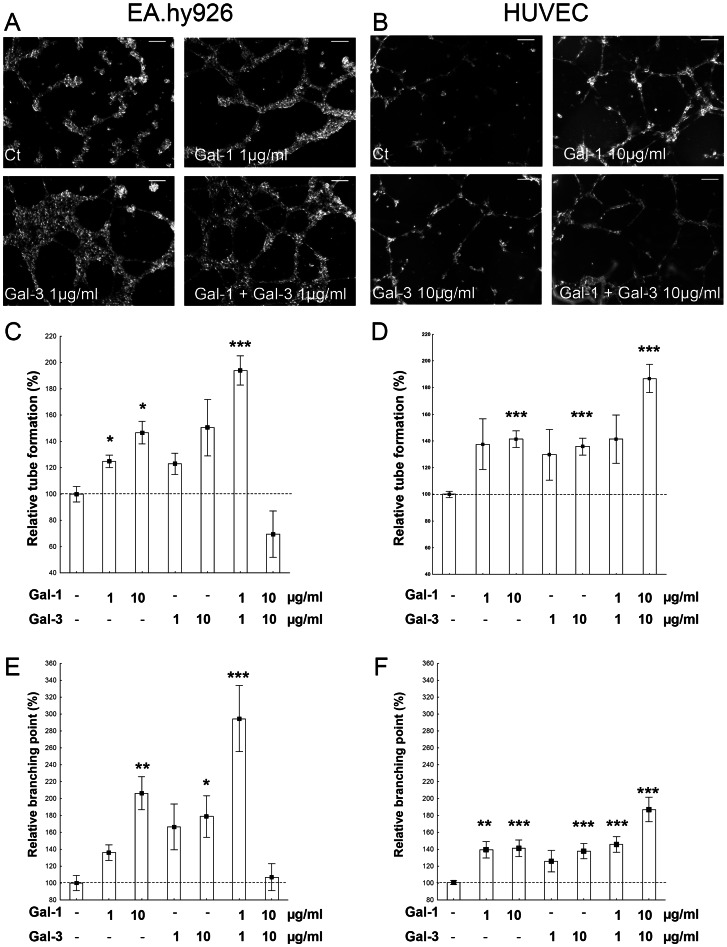
Figure 2. Modulation of tube formation by exogenous galectins.
EA.hy926 (A, C, E) and HUVEC (B, D, F) cells were suspended in complete medium in the presence or absence of galectins at the indicated concentrations and seeded on top of matrigel layers. Representative images obtained at 22 h for EA.hy926 (A) and 6 h for HUVEC (B) are shown. Tube formation was quantified by measuring the total length of the tube network (C, D) or by counting branching point (E, F) in EA.hy926 cells (C, E) and HUVECs (D, F). The data (mean +/− SEM) are shown as relative values compared with the control (no galectin addition), and significant differences are indicated (* p<0.05, ** p<0.01 and *** p<0.001). Scale bar: 300 µm.

