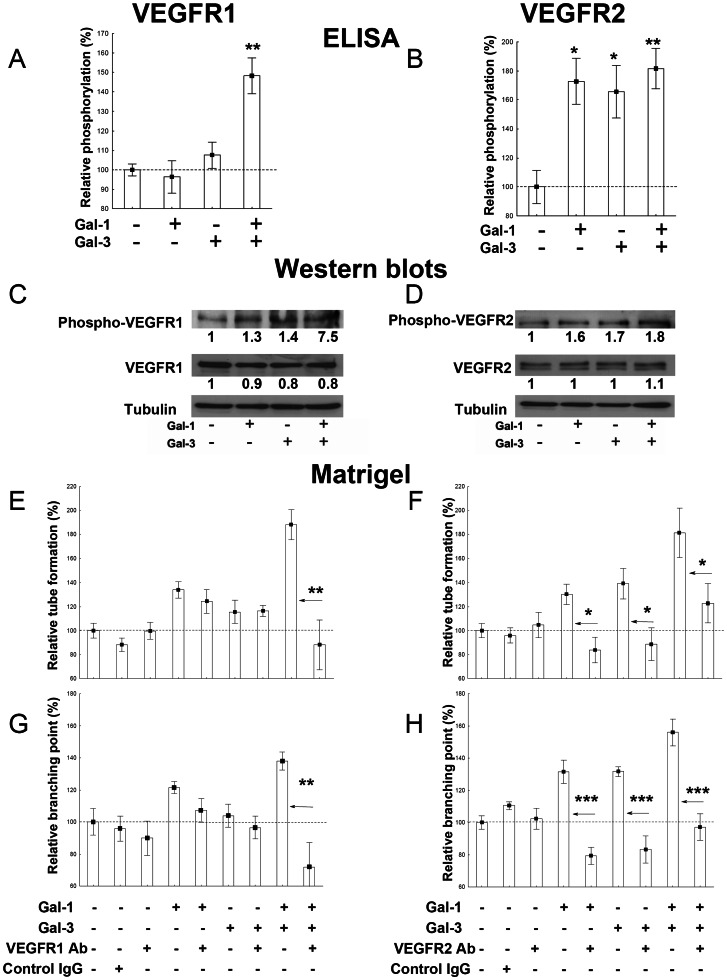
Figure 3. Effects of exogenous galectins on VEGFR activation and involvement of VEGFRs in galectin-induced tube formation.
(A–D) Determination of VEGFR1 (A, C) and VEGFR2 (B, D) phosphorylation levels following a 5-min stimulation of EA.hy926 cells with galectin-1, galectin-3 or both galectins (1 µg/ml each) by ELISA (A, B) and Western blots (C, D). For ELISAs, the data (mean +/− SEM) are shown as relative values compared with the control (no galectin addition), and significant differences are indicated (* p<0.05, ** p<0.01 and *** p<0.001). Quantification of Western blots was done using ImageJ (see Materials and Methods). (E–H) EA.hy926 cells were suspended in complete medium in the presence or absence of galectins (1 µg/ml each) and blocking VEGFR1 Ab (5 µg/ml) or control IgG (5 µg/ml) (E, G) or blocking VEGFR2 Ab (50 ng/ml) or control IgG (50 ng/ml) (F, H) and seeded on top of matrigel layers. Tube formation was quantified by measuring the total length of the tube network (E–F) or counting branching points (G–H). The data (mean +/− SEM) are shown as relative values compared with the control (without the addition of galectins or an inhibitor). Significant differences are indicated on horizontal arrows (the same galectin-related conditions were compared in the absence or presence of a blocking Ab using the Mann-Whitney test. * p<0.05, ** p<0.01 and *** p<0.001).

