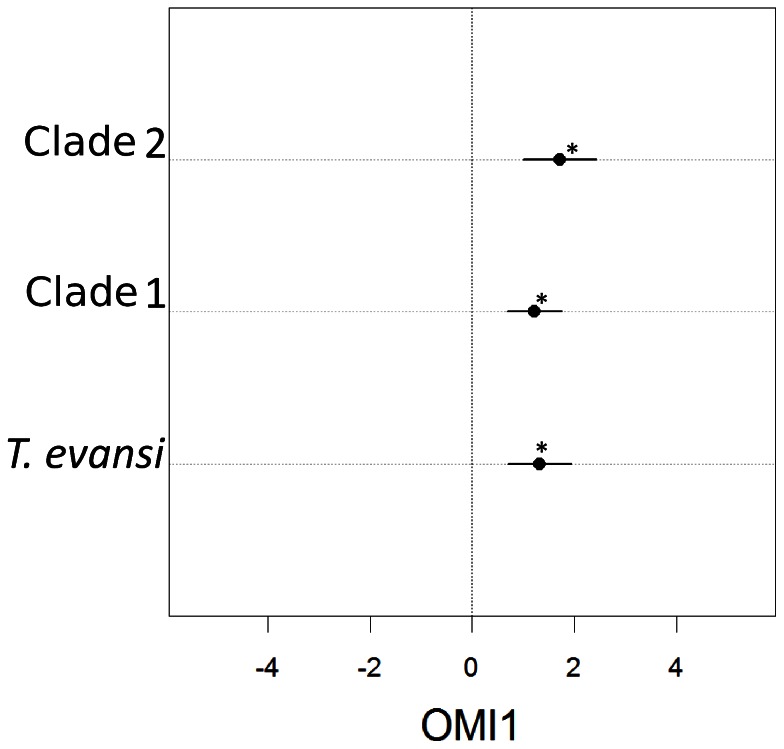
Figure 3. Results from the Outlying Mean Index (OMI) analysis along the first axis of ordination.
The vertical line indicates the mean of 100,000 sites sampled randomly from the globe. The species as well as the two clades have their mean (black dots) as well as the standard deviation (lines around the circle) in positive values for OMI 1, showing that the species occupies warm and highly variable environments. This specialization is significant for all groups (bootstrap with respect to random samples of globally available environments, one-tailed test, p-value <0.001), as indicated by *. A pairwise comparison of sites occupied by clade 1 and clade 2 also shows that clade 1 occupies significantly lower values along OMI 1 axis.

