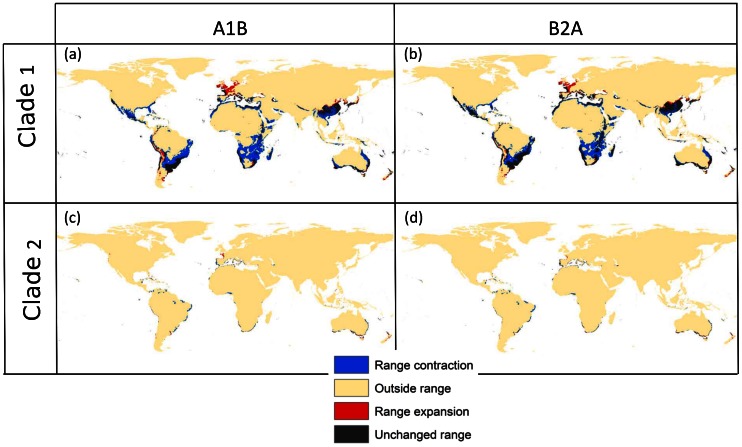
Figure 4. Potential range of mites of the two clades of T. evansi under current and future conditions.
Maps reflect predictions using a GAM modelling and assuming 50% prevalence. Black areas indicate regions that are predicted as part of the potential range both under current and future conditions; blue areas correspond to areas that are today part of the potential range but that are predicted to become outside the range under climate change conditions in 2080 (range contraction); red areas indicate potential range expansions meaning they become part of the potential range under climate change scenarios; finally yellow areas are not part of the potential range.

