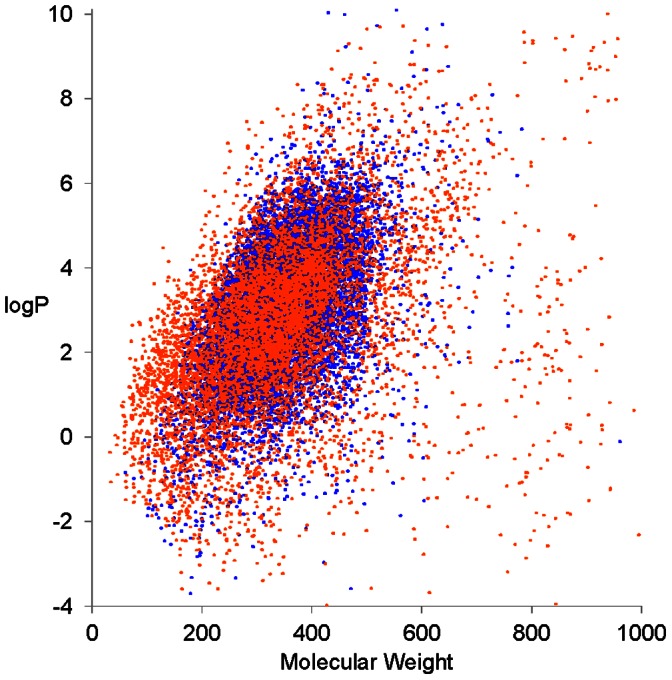
Figure 1. Chemical space covered by the dataset.

. The graph shows logP versus the molecular weight of the compounds. Work set compounds are shown as blue dots and prediction set compounds as red dots. The logP was calculated by Dragon 5.5 software (Talete.srl).
