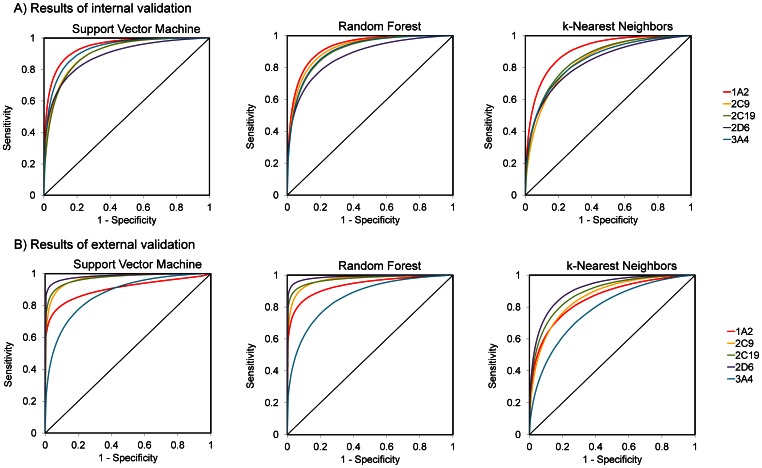
Figure 2. ROC curves for proteochemometric models of CYP inhibition.
Shown are results from models induced by Support Vector Machine, Random Forest, and k-Nearest Neighbor algorithms. Chemical compounds were described by molecular signatures of height 1–3 in all three models. Panel A presents ROC curves obtained during five-fold cross validation and panel B presents ROC curves obtained from the predictions for the external dataset. The area under the ROC curve (AUC) is a measure of the discriminatory power of a model. The numerical values of AUC of each model are given in Table 2.

