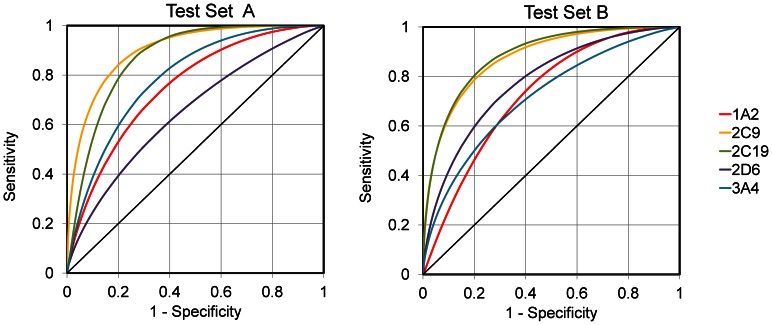
Figure 4. ROC curves for proteochemometric models built using data for 4 of 5 CYP isoforms and performing predictions for the CYP isoform not present in the model.
The models were induced by the Random Forest algorithm using molecular signatures of height 1–3. Compounds of Test Set A are from dataset of BioAssay AID = 1851; most of them are tested on several CYP isoforms and thus remained in the dataset and used during model building. Test Set B contains compounds from external dataset.

