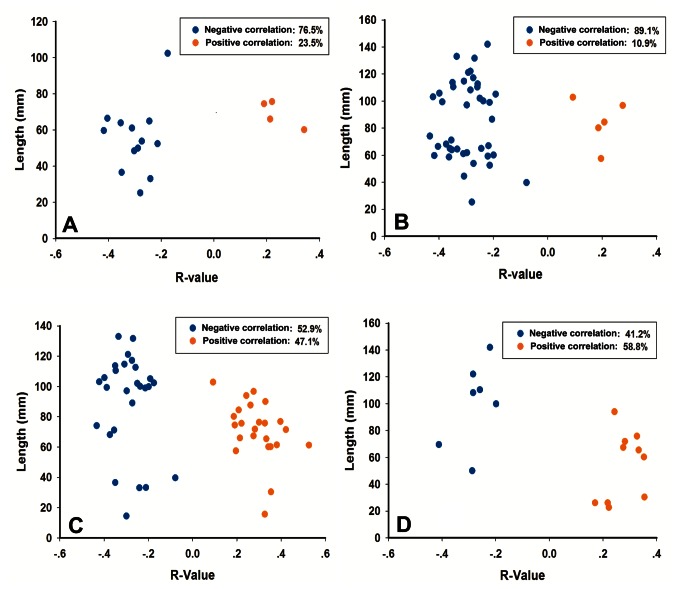
Figure 4. Characteristic patterns of abnormal functional connections within or across each cortical structure including (A) limbic/paralimbic system, (B) prefrontal cortex, (C) tempo-parietal areas and (D) visual cortex.
Dots represent abnormal connections in FD patients. R-value is the coefficient of correlation between functional connectivity and quality of life score, and the length is the Euclidean distance.

