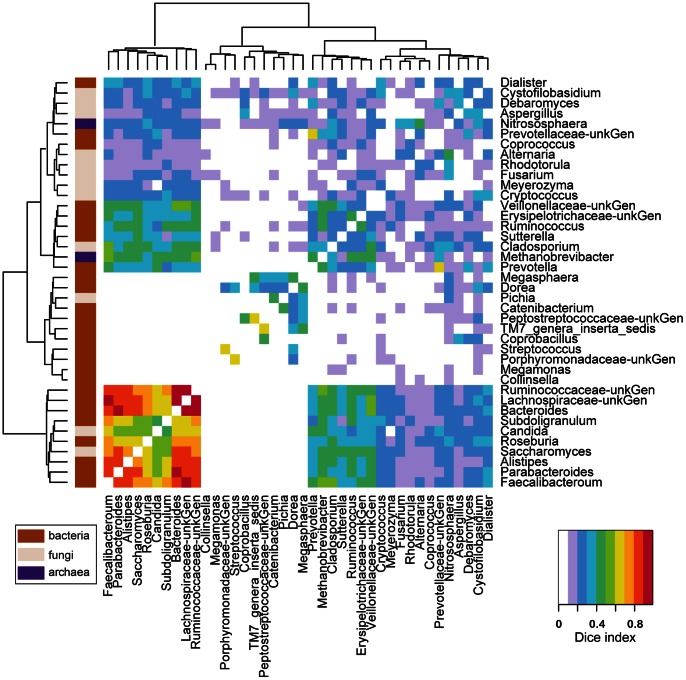
Figure 2. Analysis of co-occurrence among microbial lineages scored using the Dice index.
Dice indexes across all genera pairs present at a proportion > = 0.01 are shown as a heatmap. Clustering was carried out using Ward’s criteria, based on the Euclidian distance between each genus pair using their Dice index across all other genera. Domain membership is color-coded on the left. Data are summarized in Table S9 and S10.

