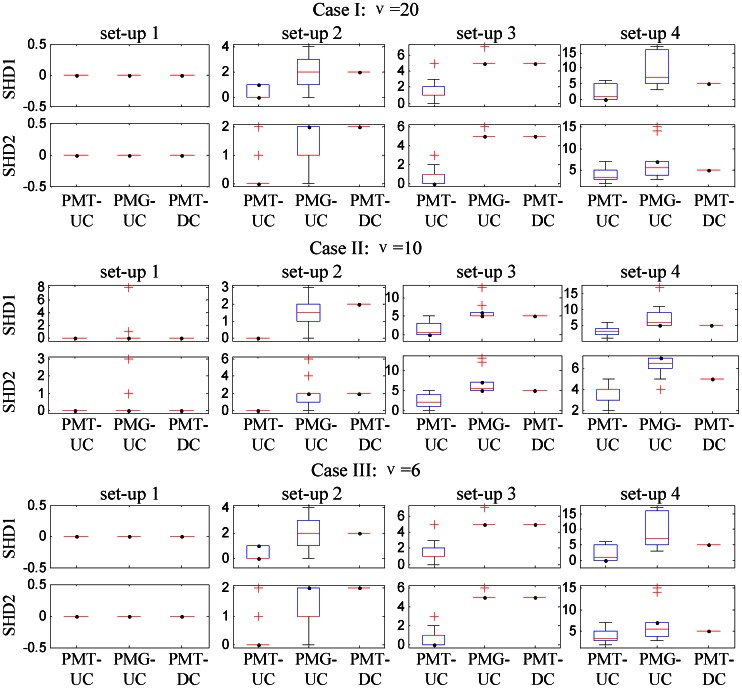
Figure 2. Boxplots of structural hamming distance (SHD) between correct and inferred networks.
On each box, the central mark is the median, the edges of the box are the 25th and 75th percentiles, the whiskers extend to the most extreme data points not considered outliers, and outliers are plotted individually. Results shown for PMT-UC, PMG-UC and PMT-DC in the four set-ups of three cases  . SHD1 and SHD2 are the results for the first and second clusters, respectively.

