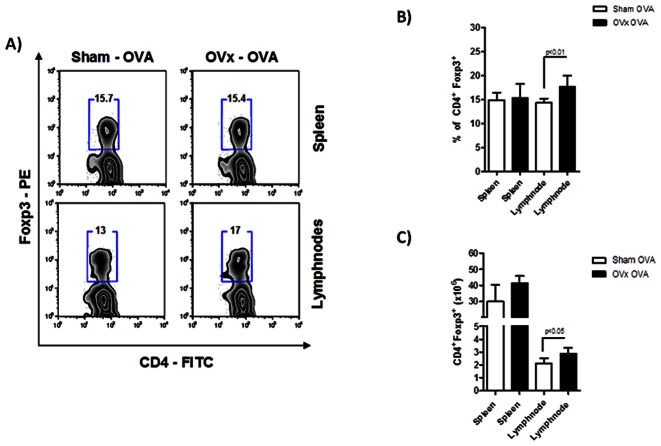
Figure 3. Flow cytometric analysis of Tregs in spleen, lymph nodes of ovariectomized and sensitized mice.
7 days after sensitization, OVx -OVA and Sham -OVA mice were sacrificed and spleen and lymph node cells were submitted to flow cytometry protocol and stained for CD4– FITC, CD8–PeCy5 and Foxp3– PE. In A) zebra plots demonstrate the gates used and the percentage of positive cells. In B, relative and C, absolute numbers of Tregs. Graph representative of three independent experiments. One way-ANOVA p<0.01. n = 5 animals per group.

