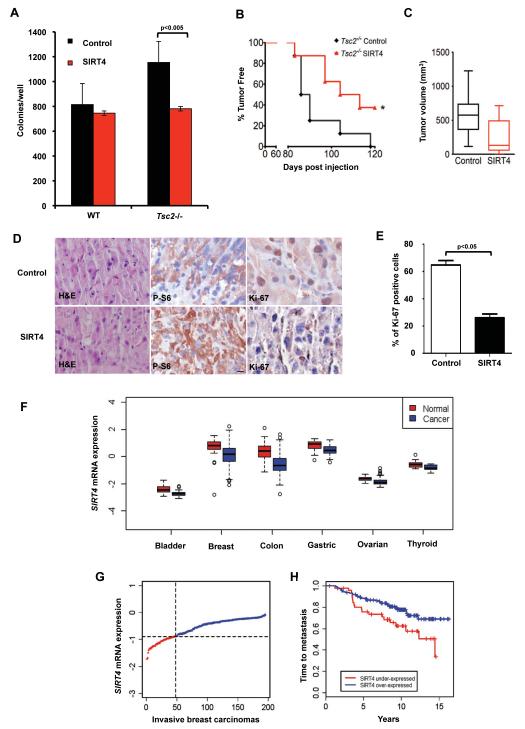
Figure 6. SIRT4 suppresses TSC-tumor development.
(A) Soft agar assays using Tsc2−/− or Tsc2-WT MEFs expressing control vector or SIRT4. (B) Kaplan-Meier plot of the percentage of tumor-free mice after inoculation with Tsc2−/−p53−/− MEFs expressing control or SIRT4 vectors (n=8). *p<0.05. (C) Tumor volume and weight were measured. (D) Immunohistochemical analysis of Ki-67 and representative H&E staining (Original magnification, 20x). (E) Quantification of Ki-67 staining in tumors from (D). (F) Box-plots indicating significantly lower expression of SIRT4 gene in bladder, breast, colon, gastric, ovarian and thyroid carcinomas compared to corresponding normal (*p<0.05). (G) Ranked SIRT4 expression in a breast carcinoma dataset of 195 tumors. (H) Kaplan-Meier curve comparing time to metastasis between breast carcinomas with the lowest (<25th percentile) vs. highest (>25th percentile) SIRT4 expression (p=0.02, log-rank test). The mean is shown; error bars represent SEM (n>3). See also Figure S6.

