
Fig. 5.
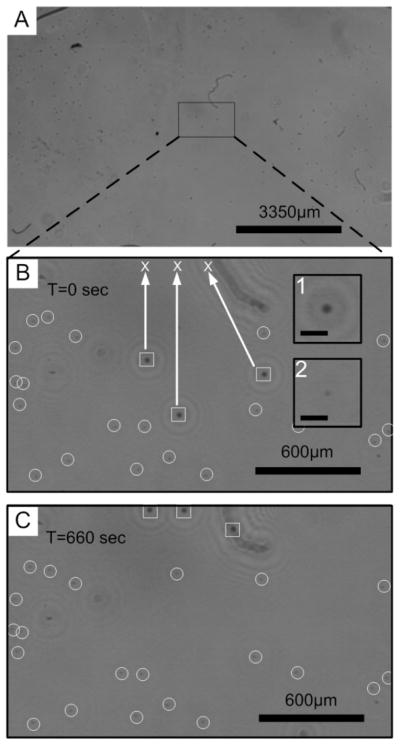
(A) A full field of view of reconstructed image with a mixture of 10 and 30 μm particles. (B) A digitally zoomed reconstructed image. The squares show the initial positions of the three selected 30-μm particles. The circles point to 10-μm particles. 30-μm particles were selected to move to the final destinations marked by crosses. The inset 1 and 2 are the enlarged images of 30 and 10-μm particles respectively. The scale bars are 90 μm. (C) The final positions of the particles after OET manipulation.