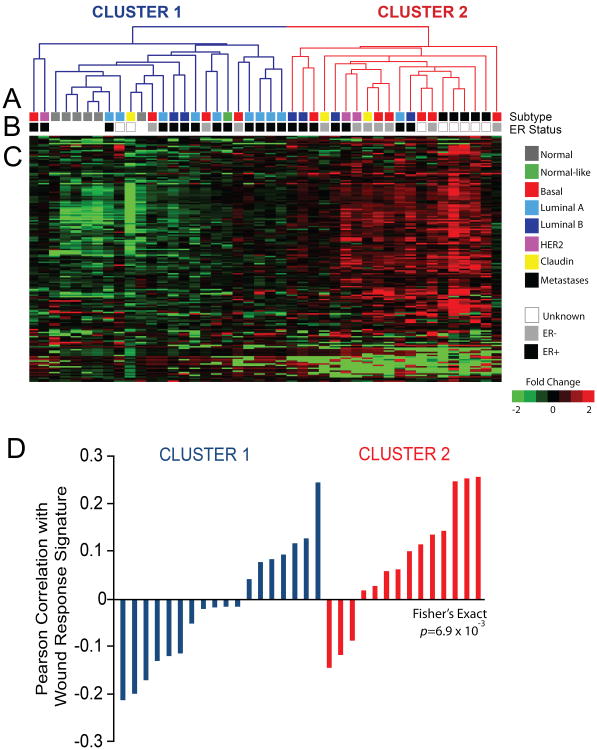
Figure 1. Unsupervised cluster analysis of 379 metabolites resulted in two main clusters (Clusters 1 and 2).
(A). Cluster 1 (blue lines in dendrogram) included less aggressive tumor types or normal breast samples, while Cluster 2 (red lines in dendrogram) included more aggressive tumors and metastases (B, colored bars). Clusters of metabolites in the heatmap (C) implicated hallmark Warburg phenotypes in aggressive tumors: elevated levels of amino acids, nucleic acids, and decreased steady state levels of sugars/carbohydrates and citric acid cycle metabolites. Pearson correlation of tumor gene expression with a previously published wound response signature shows a role for stromal activation in Cluster 2; that is, metabolic class was strongly correlated with expression of an in vivo wound response signature (25) (D).

