
Table 3.
Correlation matrix using phenotypic mean values for the 12 traits studied in three experiments
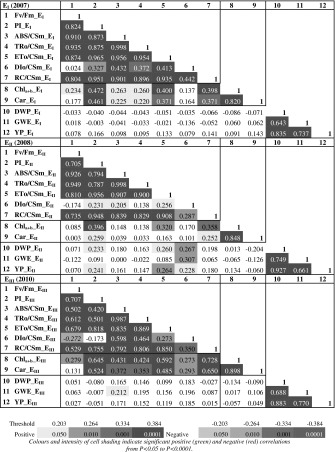
Value in italics denotes significant negative correlation coefficient
Official websites use .gov
A
.gov website belongs to an official
government organization in the United States.
Secure .gov websites use HTTPS
A lock (
) or https:// means you've safely
connected to the .gov website. Share sensitive
information only on official, secure websites.
Correlation matrix using phenotypic mean values for the 12 traits studied in three experiments
Value in italics denotes significant negative correlation coefficient