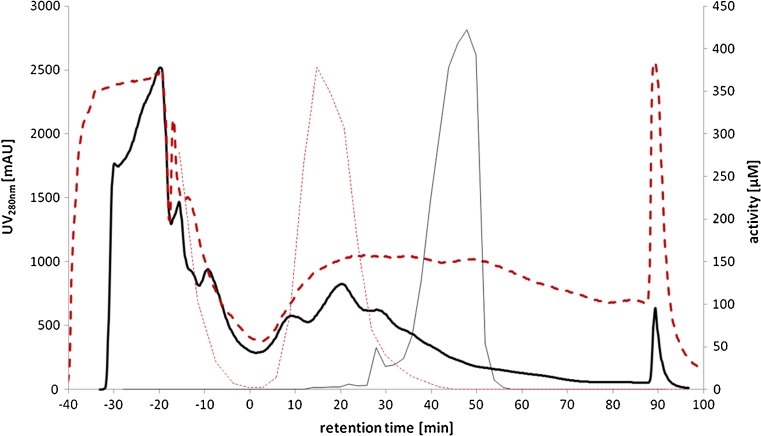
Fig. 1.
AXC purification with normalized RT because of different loading volumes (gradient starts at 0 min), negative retention time shows loading and wash out unbound sample: UV280nm signal from purification of E. coli wild type (thick solid line), analyzed fraction (1.5 ml) activity of E. coli wild type (thin solid line), UV280nm signal from purification of E. coli Δyahk (thick broken line), analyzed fraction (1.5 ml) activity of E. coli Δyahk (thin broken line)

