
Figure 4.
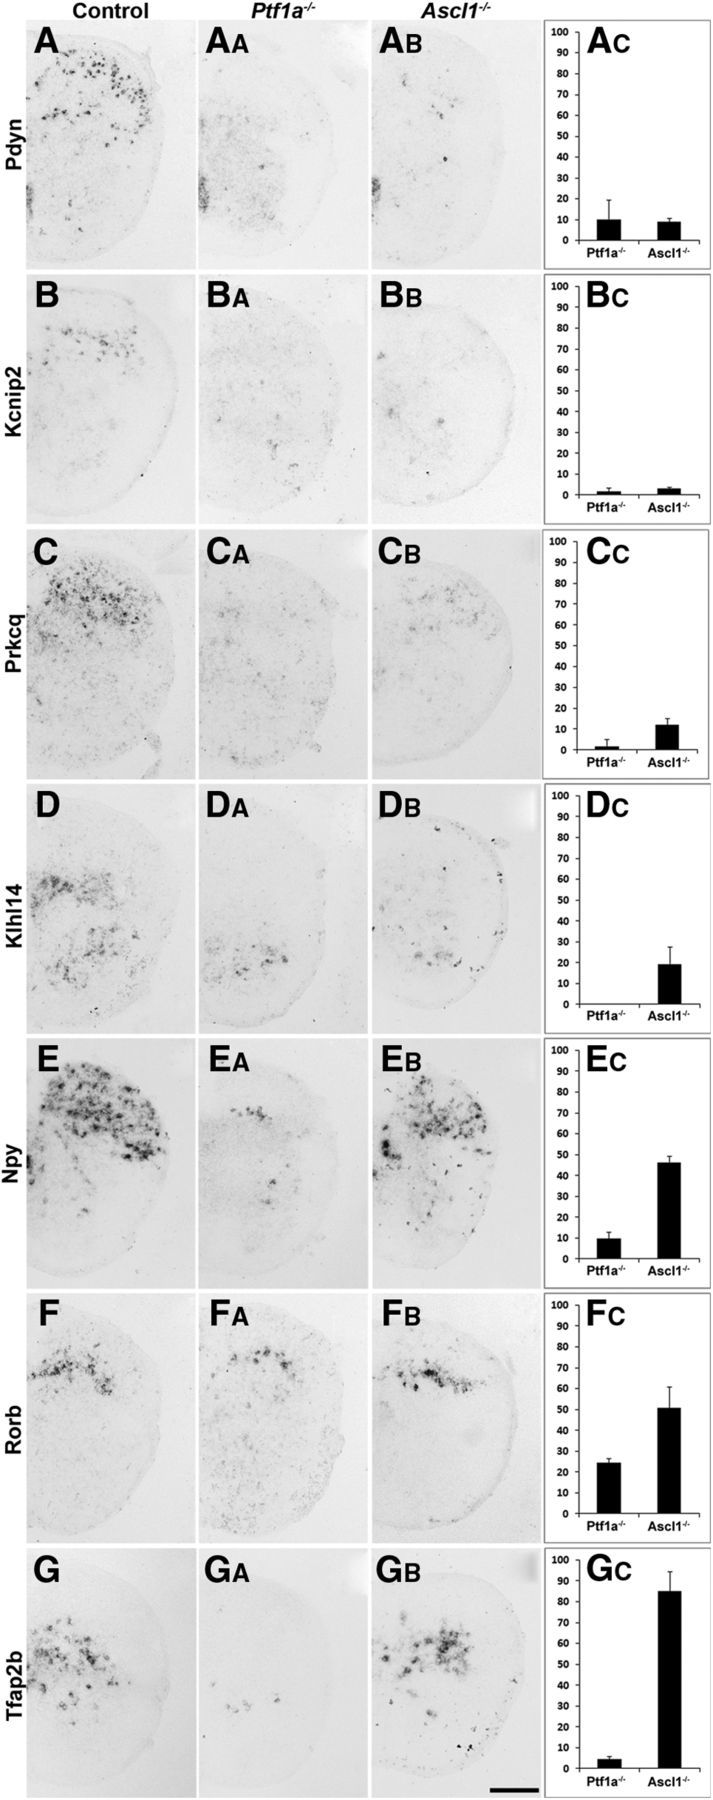
Identification of expression domains marked by genes downregulated in Ptf1a−/− and/or Ascl1−/− mice. A–GB, In situ hybridization on spinal cords of control, Ptf1a−/−, and Ascl1−/− mice at E18.5 using probes specific for pDyn, Kcnip2, Rorb, Tfap2b, Prkcq, Klhl14, and Npy. AC–GC, Quantification of the number of neurons expressing the respective gene in Ptf1a−/− or Ascl1−/− mice relative to control. Expression of the more superficially expressed genes pDyn (A–AC), Kcnip2 (B–BC), and Prkcq (C, CC) is reduced to <10% of control levels in Ptf1a−/− and Ascl1−/− mice. Expression of NPY (E–EC) and Tfap2b (G–GC) is almost completely lost in Ptf1a−/− but only reduced to 50 or 85% in Mash−/−, respectively. Error bars represent the SD. Scale bar, 200 μm.