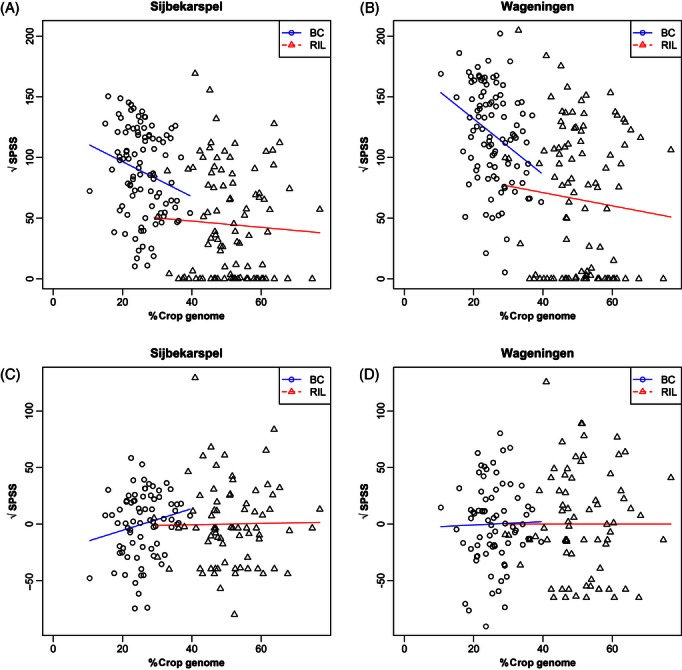
Figure 3.

Relationship between the amount of crop genome (%) on the average Seeds Produced per Seed Sown (square-root-transformed) for each backcross (BC1) family and recombinant inbred line (RIL). (A, B) simple regression of fitness on crop genome%, and (C, D) residual regression after the effects of the two major fitness quantitative trait loci were taken out, as covariates; Sites: Sijbekarspel (A and C) and Wageningen (B and D). Dots indicate BC lines and triangles indicate RIL averages. Regression equations:
