
Figure 2.
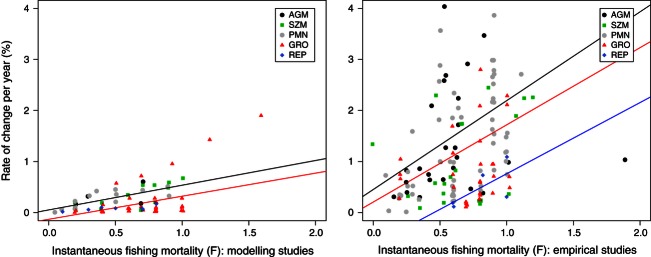
Rates of phenotypic change for five trait types as reported in empirical and modelling studies. Trait types: age at maturity (AGM), size at maturity (SZM), midpoint of the probabilistic maturation reaction norm (PMN), growth traits (GRO) and reproductive investment traits (REP). Least-square fit regression lines were fitted to the groups of traits that differed significantly in the linear model analyses (Table 1); for the regression fit one outlier data point F > 1.5 was removed from each of modelling and empirical data sets. Note that regression lines in the figure are fitted to raw rate values and therefore differ from those in the mixed-model analyses (fitted to log-transformed rates).