
Figure 3.
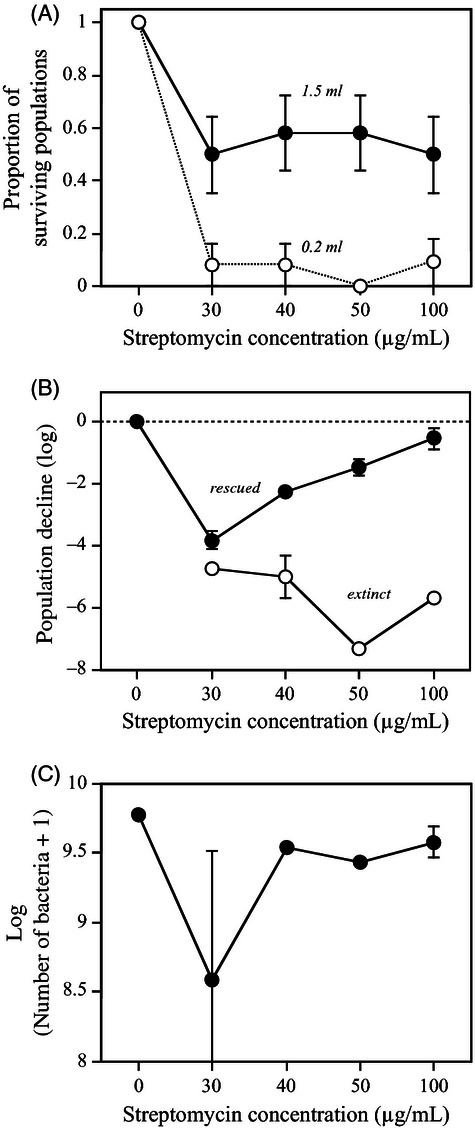
(A) Survival of small populations (0.2-mL microcosms) and large populations (1.5-mL microcosms) after 86 h in experiment 2 as a function of streptomycin concentration. (B) Mean population decline during day 2 (difference in log population size between 23 h and 48 h) of future-extinct and future-rescued populations in 1.5-mL microcosms, as a function of streptomycin concentration. (C) Mean population size (log-transformed) of rescued populations after 86 h in 1.5-mL microcosms, as a function of streptomycin concentration. Error bars represent standard error (in (A) calculated from the binomial distribution; n = 12 populations).