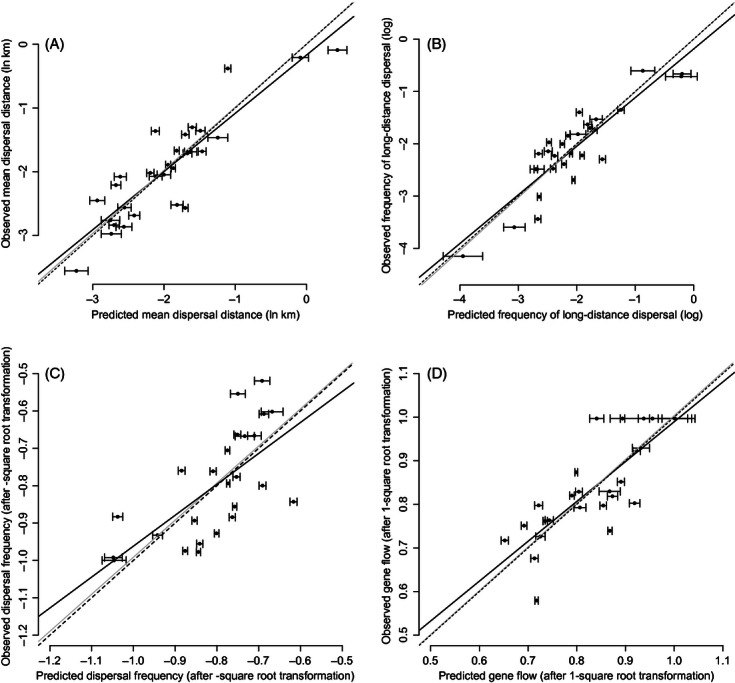
Figure 1.

Cross-validations of predictive models for butterfly dispersal: predictions obtained from information on multiple life-history traits, together with wing size (B) or not (panels A, C, D) (see Table 3). A: mean dispersal distance; B: frequency of long-distance dispersal; C: dispersal propensity; D: intensity of gene flow, observed for 25–30 butterfly species, all plotted against the man predicted values and their respective 95% CI (obtained with 100 random partitions). Black lines show the linear regressions; for comparison dotted lines show the slope 1:1, and gray line show the regression forced into 0:0. Stevens et al.
