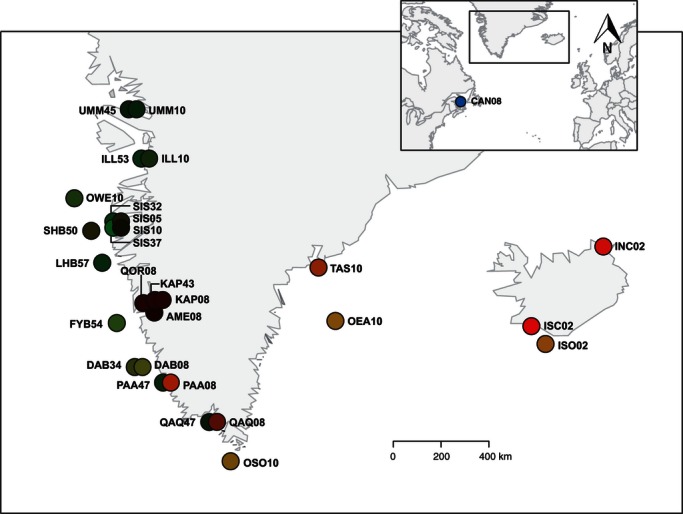
Figure 1.

Approximate sampling locations in Greenland and Iceland (main map) shown in relation to the reference sample from Canada (blue dot on the inset map). Dots shifted left represent historical samples while dots shifted right represent contemporary samples. Samples are named by three-letter codes to indicate the location followed by two digits to indicate the sampling year (see Table 1; note the mixed origin of OWE10). For all samples except CAN08, the colors of the dots represent the blends of sample mean coordinates on the first two discriminant functions recoded as signal intensities of red and green, respectively (see text and Fig. 2a).
