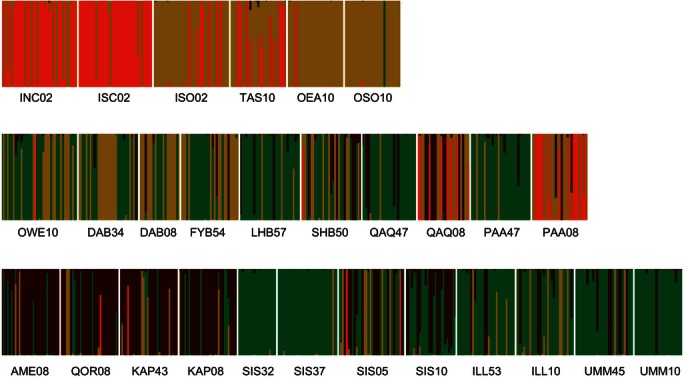
Figure 3.

Plot of the posterior membership probabilities of each individual to the Iceland inshore (yellow), East (red), West (green), and Nuuk (brown) clusters, respectively. Each vertical line represents an individual and is divided into color segments proportional to its posterior membership probability to each of the geographic clusters derived from the discriminant analysis of principal components (DAPC) including only the ‘pure’ samples (see text). The order of individuals within samples is random, but samples are ordered according to hydrographic distance from the easternmost sample.
