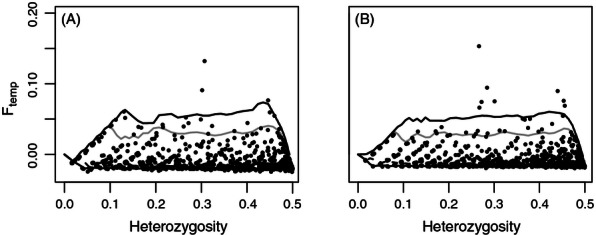
Figure 5.

Examples of temporal outlier detection results in DAB (A) and KAP (B). Each dot represents a locus, illustrating its temporal differentiation (Ftemp, y-axis) against its heterozygosity (x-axis). The lines represent the 95% (gray) and the 99% (black) confidence envelopes of the simulated neutral distribution.
