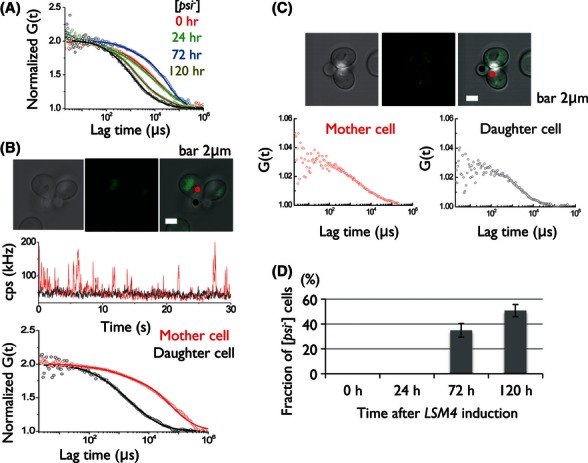
Figure 5.

[PSI+] oligomers underwent size increase upon LSM4 overexpression. The [PSI+][rnq-] sup35::SUP35-GFP strain (ND21) was transformed with pRS413GAL1p-LSM4 (expressing LSM4 under the galactose-inducible GAL1 promoter). Transformants were precultured to log phase in SSuc-His, induced the LSM4 expression by galactose addition, and subjected to FCS at each time point. (A) Representative normalized autocorrelation functions of Sup35-GFP in mother cells from [psi−] cells (black), [PSI+] cells before LSM4 induction (red), 24 (green), 72 (blue), and 120 h (brown) after LSM4 induction. Fitting results by a two-component model are depicted by solid lines. (B) Mother–daughter asymmetry of the Sup35-GFP aggregation status observed at 72 h after LSM4 induction. Top: The fluorescent image of the mother and daughter cell pair used for FCS measurement. Bar: 2 μm. Middle: Traces of average fluorescence intensities (counts per second: cps) for Sup35-GFP in a single [PSI+] cell pair of mother (red) and daughter (black). Bottom: Normalized fluorescence autocorrelation functions of the single [PSI+] cell pair of mother (red) and daughter (black), showing a clear contrast between the two. (C) Emergence of huge Sup35-GFP foci at 120 h after induction. Top: The fluorescent image of the cell pair of mother (red; foci present) and daughter (black) at 120 h. Bar: 2 μm. Bottom: Normalized fluorescence autocorrelation functions of the single cell pairs of the mother (red) and daughter (black), both showing a similar [psi−]-like pattern besides the presence of foci. (D) Fraction of [psi−] cells after the induction of LSM4.
