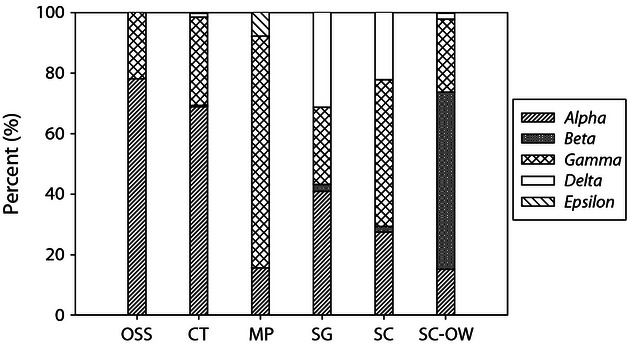
Figure 2.

Relative percentages of different classes of Proteobacteria in oil mousses (OSS, CT, and MP), sediments (SG and SC), and overlying waters of SC sediment (SC-OW). OSS, oil spill site; CT, control; MP, Marsh Point; SG, station Grab; SC, station Core.
